Qualys Network Discovery
Lets test out the Network Discovery feature. I am curious to see what exactly it will come up with. My lab network as stated before and in previous home lab entries, consists of 3 Proxmox nodes running any number of VMs and containers, 5 port switch, and a Zimaboard running PFsense as a router/firewall.
Qualys official documentation states that the feature is allows for discovery of hosts on a network, regardless of if the hosts have been added to a Qualys implementation or not. It will also report on hosts that are not up and live that have been added to a Qualys implementation. 1
Note that, In order to initiate a network discovery scan, you first need to setup a scanner appliance, which we have already done in the previous steps of this project.
Setup up a Discovery Scan
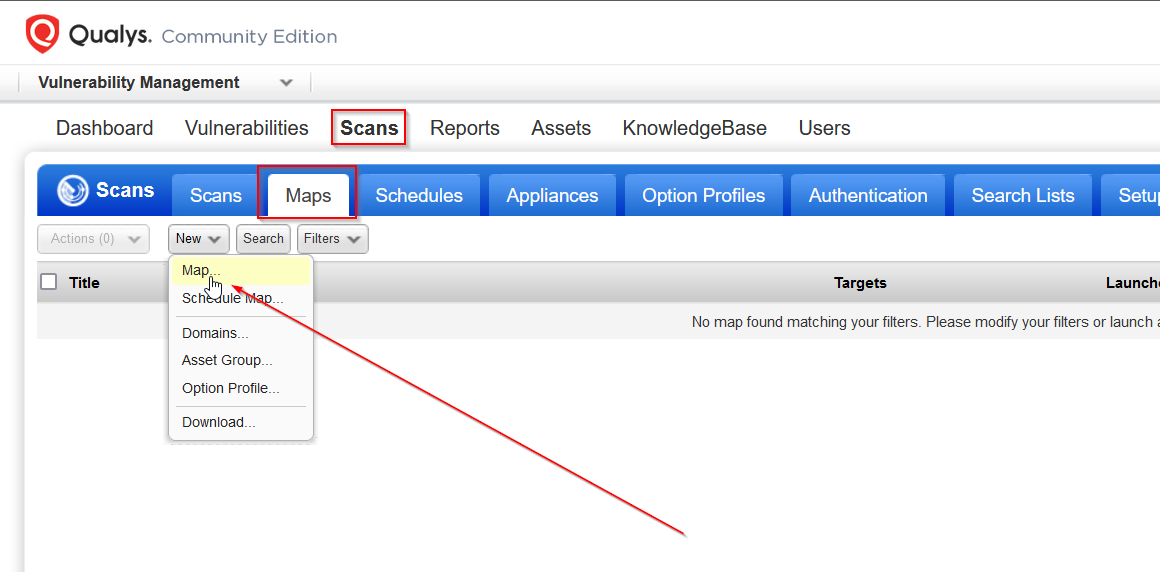
To start scanning and discovering elements of our network, from the Qualys dashboard we go to Scans and then click Maps from there we configure our discover scan.
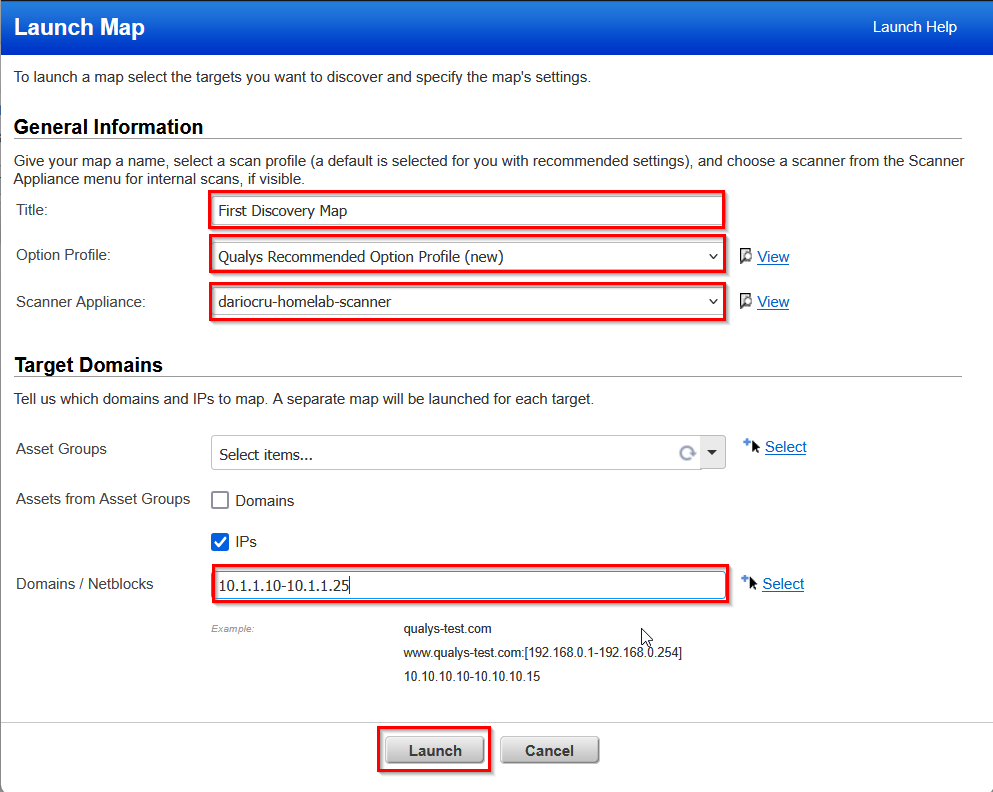
From the menu windows that pops up I configured all of the information needed. I gave my network discovery scan a name First Discovery Scan, chose the Qualys Recommended Option for our scan settings, set the scope to the range of IP addresses for my home lab network 10.1.1.1-10.1.1.25, I then launched the scan.
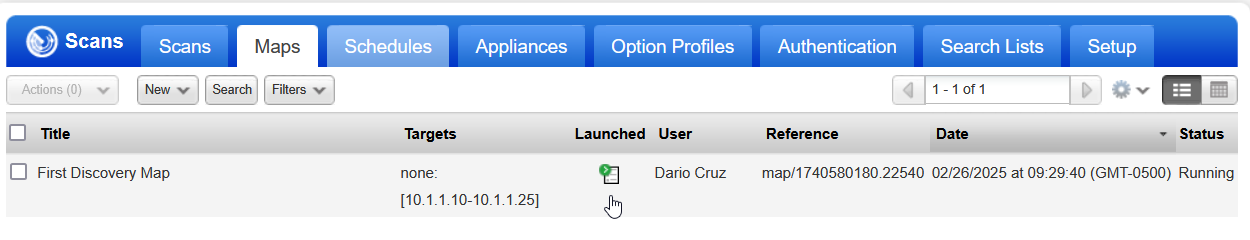
After launching the network discovery scan we are placed back at the Qualys scan dashboard and now have an entry for the created scan, now we wait for the discovery scan to be completed by our scanner appliance and report on it's findings.
Analyzing Results
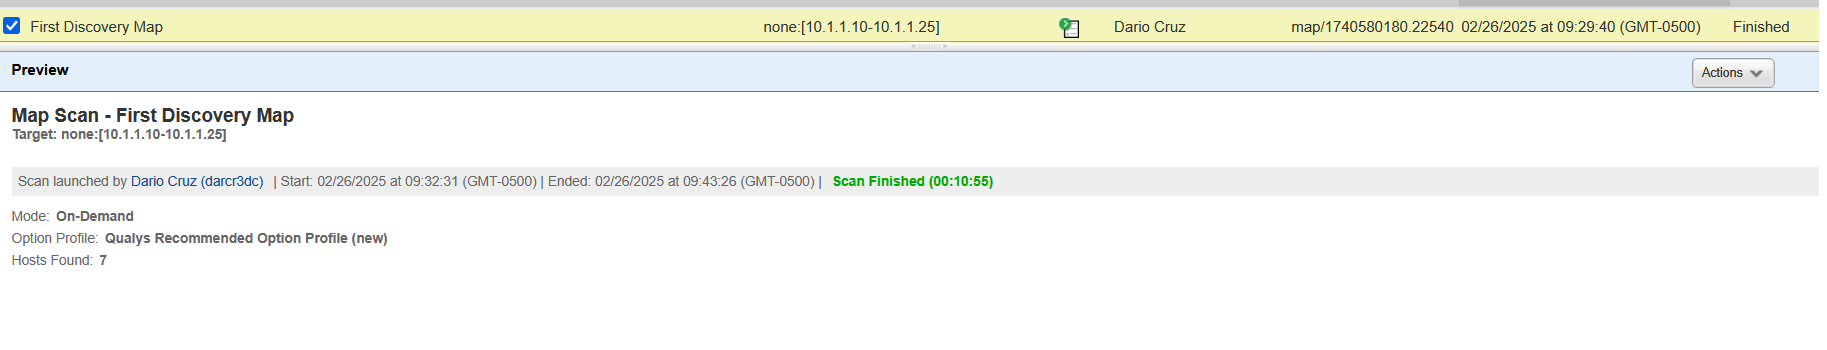
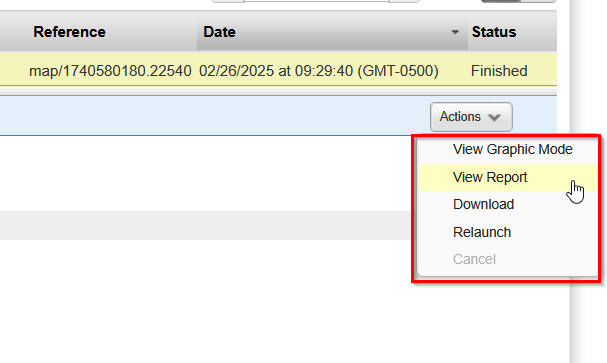
In my instance the network discovery scan took about 10 minutes. When the scan is finished the status will update and show you a small summary of what was found. Looking at the image below you can see that 7 hosts in total where found as a result.
On the right side of the Qualys web interface, after clicking on the scan task, there is an set of actions to choose from, we can view the report of findings in two ways, graphical, or just as a normal report. There are also options for relaunching the scan and downloading the report of results. Lets first look at the report and see what the scanner appliance was able to find.
Here we are at the full report of findings for our network discovery scan. We have a list of the settings for the scan. The time and date that the scan was completed, the settings and scope of the scan, and a list of IP addresses found with NETBIOS information.
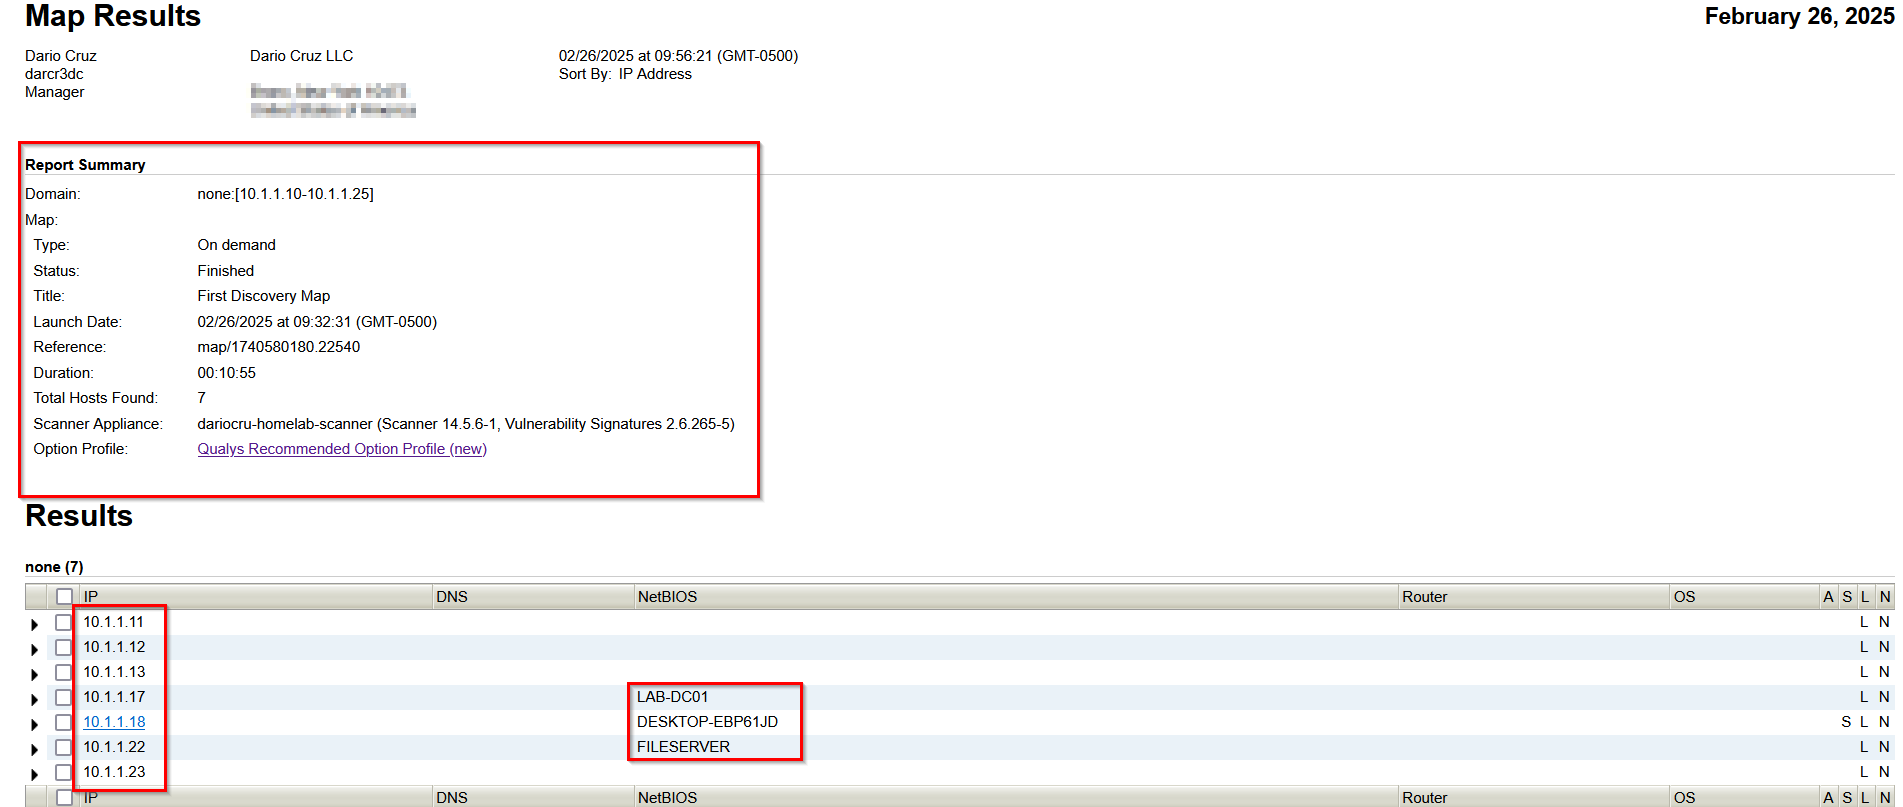 I can see in the list the hostname LAB-DC01, which is my Windows Server 2019 VM that has Active Directory domain services running on it for a separate project. I can also see the hostname for our vulnerable Windows 10 machine, DESKTOP-EBP61JD. Lastly, there is a host with the NETBIOS name of FILESERVER, which is a Turnkey Linux container that is hosting an SMB share. I spin up this container when I need to transfer files between VM's my home lab network.
Clicking on the drop down tabs to the left of the found IP addresses, reveals what ports were found open on the host. Looking at my domain controller I can see that TCP ports 53, 80, 135, 139, & 445 are open as well as UDP ports 53 & 137.
 Ports 137, 138, 139, and 445 are all used for SMB. SMB is used by Active Directory for group policy setting distribution through out a domain via the
 SYSVOL hidden share. They are also used for any smb network shares that are configured for the domain as well.
Our vulnerable Windows 10 machine also has a similar set of ports open for the smb protocol but also, has the addition of TCP port 135. This port is used for the RPC Endpoint Mapper service, which is a Windows service that allows other systems on a given network, to discover what services are advertised by a host, and what port to find them on. 2

Moving on to the Turnkey fileserver. We also see similar ports with the addition of TCP ports 21, 22, 111 and UDP port 111. Ports 20/21 are both used for the FTP Protocol, Ports 111 UPD and TCP are used for the RPC portmapper service, allowing for discover of ports for RPC services. 3

The remaining IP addresses 10.1.1.11, 10.1.1.12, and 10.1.1.13 are the Proxmox nodes for the home lab. All 3 nodes reported the same ports open TCP ports 21, 111 and UDP 111, both of which we have already spoke about. IP address 10.1.1.23 is a Kali Linux VM that I am using for Hack The Box academy modules and sherlock investigations. The host does not report any ports being open.


Graphical View
The second option for viewing results of network discovery scans is via the graphical view. To open it we navigate to our finished scan > actions > view graphical mode.

The graphical view itself is very straight forward. Depending on the network topology, the graphical view will show a map of the given network that the scanner appliance is running on. In our case my home lab network is fairly simple. Clicking on a item in the graphical view will display much of the same information as with the regular report.
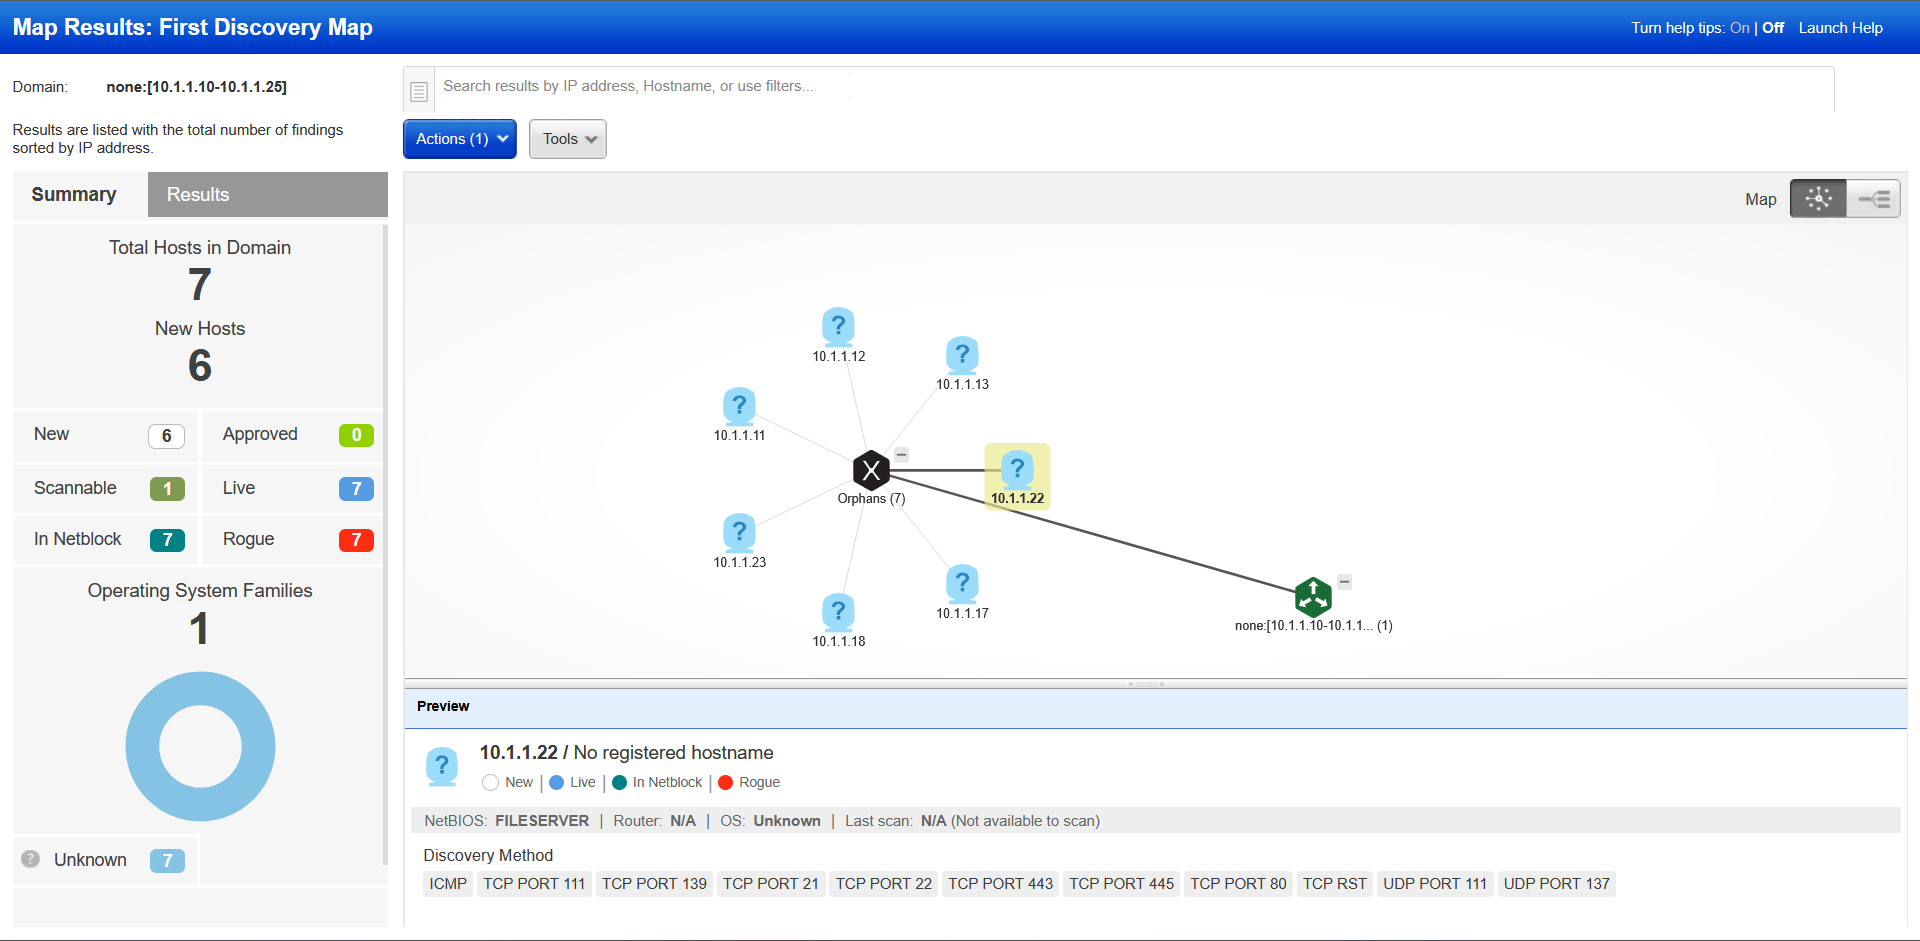 All of the hosts discovered on my home lab network are being labelled as rogue, due to the fact that I have not ingested them into Qualys' asset management function.